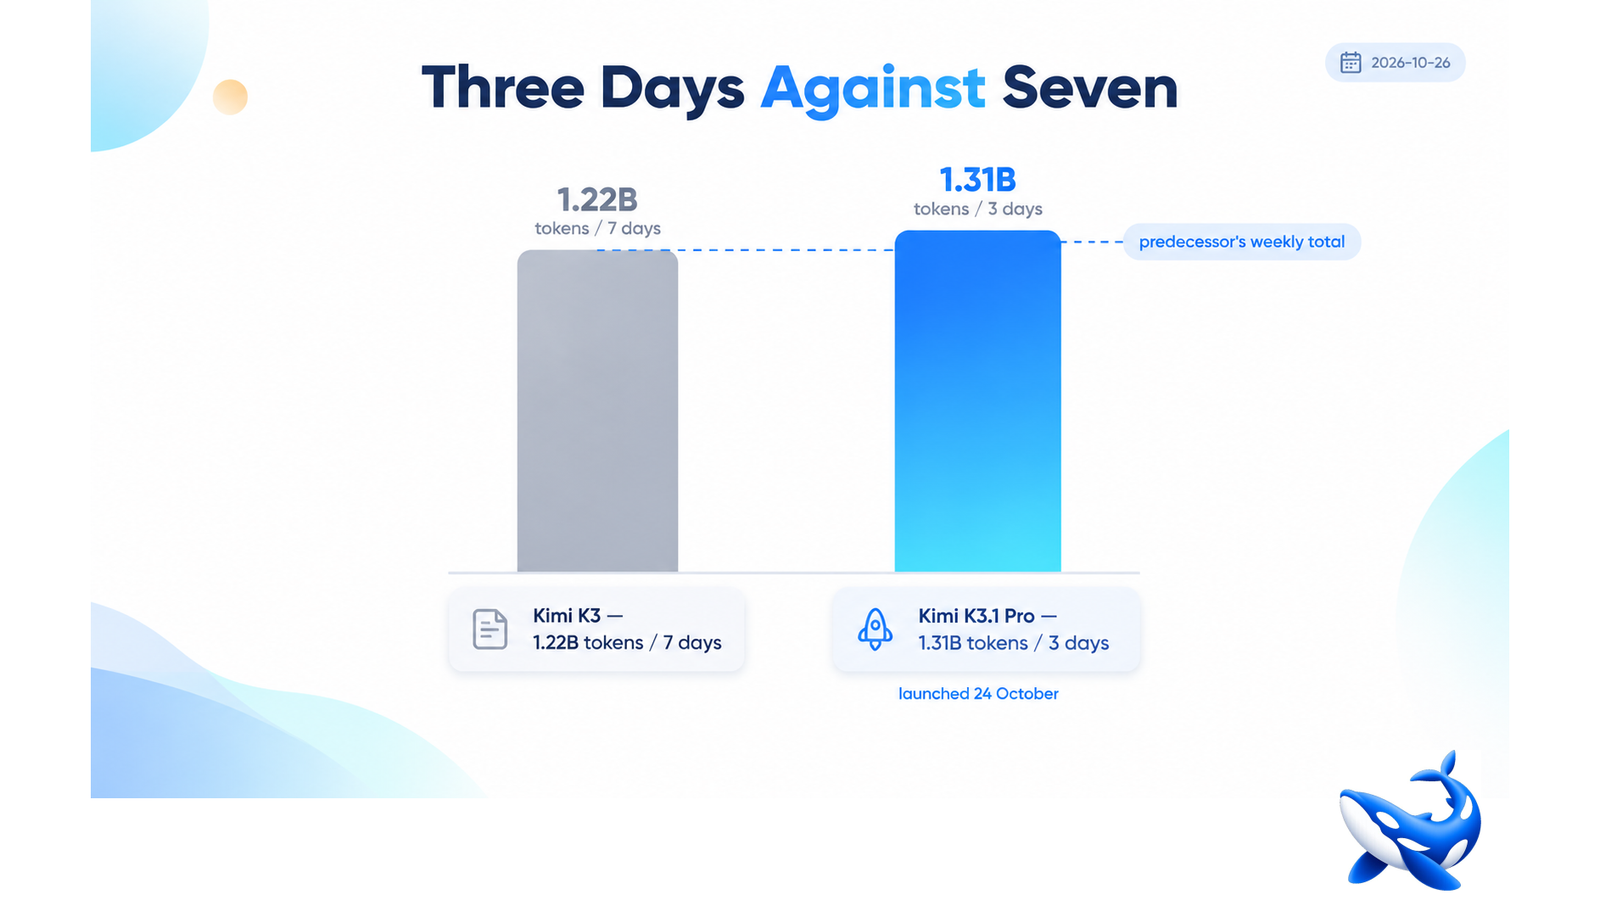
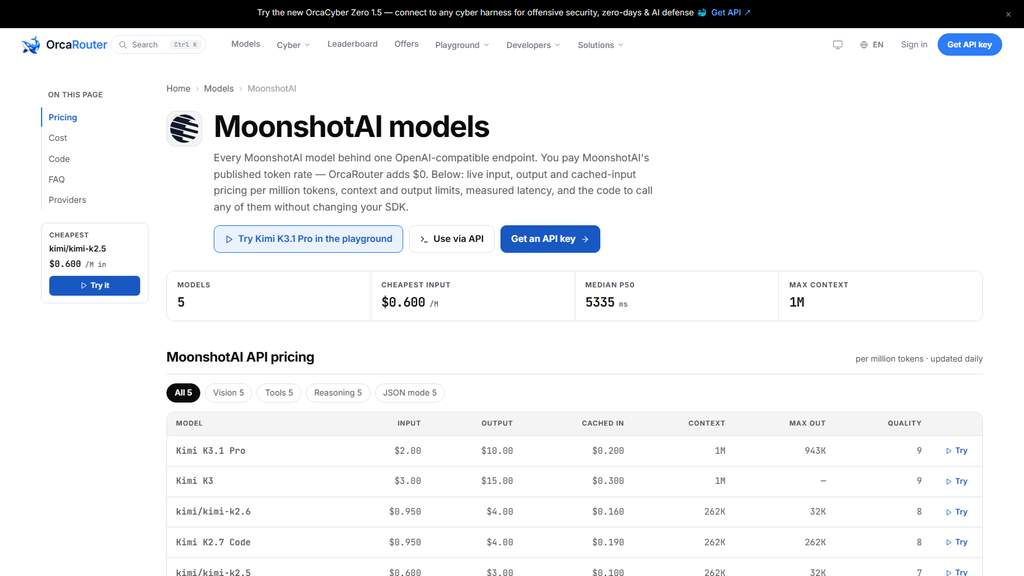
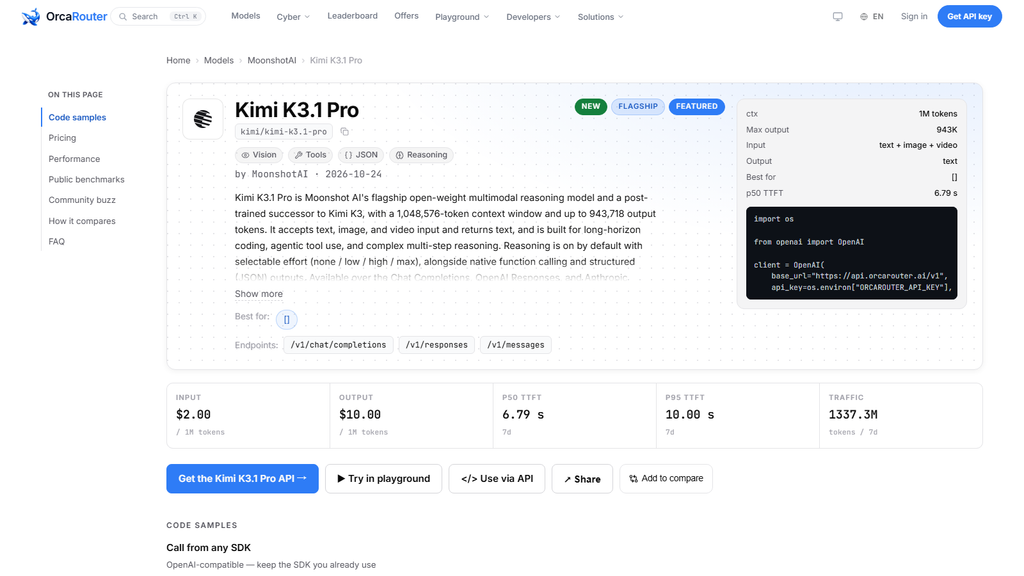
Kimi K3.1 Pro launched on 24 October. In the seven days ending 26 October it moved 1,305,390,288 tokens on our route. Kimi K3, the model it replaces, moved 1,222,126,729 over the same seven-day window [OURS]. The new model did that in three days, which puts its daily run-rate at about 2.5 times its predecessor’s — on the same catalogue, behind the same key, at the same price pass-through. The OrcaRouter card for Kimi K3.1 Pro carries the volume figure next to a $2.00/$10.00 rate passed through at list, which makes this a rare thing in model coverage: an adoption number rather than a claim about adoption.
It is also the quietest launch of the season. On the same week, the model drew six mentions on Hacker News against zero the week before, with no strongly negative sentiment [OURS-observed sentiment feed]. Six. A model that overtook its own predecessor’s weekly volume in three days generated less discussion than a minor open-source release.
The numbers, across the Kimi line
| Model | 7-day tokens | Share of Kimi line | p50 | Output tok/s |
| Kimi K3.1 Pro | 1,305.4M | 48.9% | 6,752 ms | 52.4 |
| Kimi K3 | 1,222.1M | 45.8% | 4,680 ms | 28.8 |
| Kimi K2.6 | 107.9M | 4.0% | 5,989 ms | 142.9 |
| Kimi K2.7 Code | 45.4M | 1.7% | 3,390 ms | 59.6 |
Three observations that the table makes visible and a launch post does not.
Migration is happening faster than the marketing suggests. A model that reaches half of its vendor’s traffic within three days of launch, without a single published benchmark sweep against the previous generation, is being adopted on price and on the vendor’s word. The 33% cut on all three billed lines [VENDOR] is the only explanation that fits the shape.
The predecessor is not dead yet. Kimi K3 still carries 45.8% of the line’s volume and will for weeks, because a model swap in production is a code review, a regression test and a budget request. Expect the crossover to take a month, not a week.
The cheap models are a small tail. K2.6 and K2.7 Code together are 5.7% of the line. The Kimi line on our route is effectively two models, and both are $2-$3 input. That is an unusual distribution for a family with a cheap coder in it, and it says something about what buyers use Kimi for: large-context work, not cheap classification.
Why the quiet matters
Attention and usage have decoupled, and this release is the clearest example so far.
The models that dominate discussion are the ones with dramatic benchmark claims, dramatic safety stories or dramatic pricing moves. This one has a modest pricing move (a third), a modest index position (fourth), and one genuinely dramatic number (67% on Terminal-Bench). Its coverage largely framed it as “close to the frontier at a fifth the price” — accurate, unexciting, and apparently sufficient.
For a buyer, that pattern is useful information in itself. A model can be in production at scale while being absent from the conversation, which means community sentiment is a poor proxy for reliability. The traffic is the better signal: teams running real workloads are voting with tokens, and the vote started immediately.
What the volume does not tell you
It does not tell you the workload. Our catalogue sees token counts, not purposes. Some of that 1.3B is almost certainly large-context ingestion — the model’s 1M window and $0.20 cache read make it attractive for document pipelines — and some is agentic coding. A token-weighted average can hide an enormous difference in request count.
It does not tell you retention. Three days of launch traffic includes trials that will not convert. The number to watch is the same figure in four weeks: if Kimi K3.1 Pro holds above a billion tokens a week once the trial traffic settles, adoption is real.
It does not tell you the error profile. The model shows a 0.064% error rate on our route over the window [OURS], which is good and non-zero; a workload that retries on error early in a burst will pay for cache writes it did not need.
It is one route. These are OrcaRouter’s numbers, not the market’s. A different provider’s mix, prices and failover behaviour would produce a different distribution, and the vendor’s own API almost certainly sees more consumer-app traffic than any third-party route does.
One thing the volume does suggest, because it is too large to be noise: the model is being used for long-context work. At 6.75 seconds to first token and 52 tokens per second, a workload that sent short prompts and expected short answers would find it slow going. Traffic that reaches 1.3 billion tokens in three days is traffic that carries a lot of context per request, which is exactly the shape the price card rewards — $2.00 input against $0.20 cached, with the cache doing most of the work.
What would change the read
Two signals worth tracking, both visible in the same data you already have.
If K3.1 Pro crosses 70% of the Kimi line within a month, migration is complete in practice and K3’s remaining volume is stranded workloads waiting for a sprint. That is the normal outcome when a successor is both better and cheaper.
If it stalls near 50%, the reason will be one of three: the fixed sampling parameters (no temperature control), the always-on reasoning (no cheap mode), or latency (6.75 seconds p50 against the predecessor’s 4.68). Any of those can hold a workload on the old model indefinitely, and each is a real constraint rather than a preference.
The launch story was about benchmarks. The interesting story in the numbers is that the market moved first and talked later — 1.3 billion tokens in three days, six mentions on a forum, and a predecessor still running nearly half the line. The one number we cannot see is request count: two workloads can move the same token volume with very different economics, and only the provider knows which shape dominates. The distribution matters for capacity planning too: a route that carried a third of this volume last week can carry it in a day after a launch, and the p50 drift we measured over three days is what that looks like from the inside.
Sourcing note: every token count, latency, throughput and error figure is OrcaRouter’s own seven-day routing telemetry for the window ending 26 October 2026, covering traffic across our catalogue; the launch date of 24 October is Moonshot’s. The 33% price cut is Moonshot’s rate card. Mention counts are from our sentiment feed’s Hacker News snapshot. The daily run-rate multiple is our arithmetic on the window. No third-party traffic estimate is used anywhere in this article, because none of them can see request-level volume.